DISLIN Home Page
Welcome to the home page of the scientific data plotting software DISLIN.
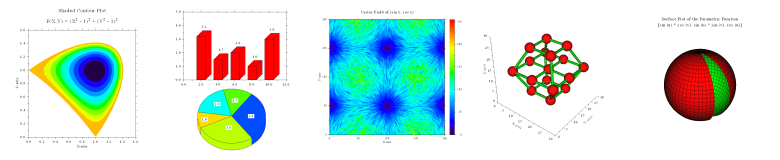
DISLIN is a high-level plotting library for displaying data as curves, polar plots, bar graphs, pie charts, 3D-color plots, surfaces, contours and maps.
DISLIN is intended to be a powerful and easy to use software package for scientists and programmers. There are only a few graphics routines with a short parameter list needed to display the desired graphical output. A large variety of parameter setting routines can then be called to create individually customized graphics.
The software is available for several C, C++, Fortran 77 and Fortran 90/95 compilers on the operating systems Unix, Linux, FreeBSD, Windows, Mac OSX and MS-DOS. DISLIN programs are very system-independent, their source codes can be ported from one operating system to another without any changes.
For some operating systems, the programming languages Perl, Python, Java, Ruby, TCL, Julia, FreeBASIC, Free Pascal, Go, R and the C/C++ interpreter Ch are also supported by DISLIN. The DISLIN interpreter DISGCL is available for all supported operating systems. See a complete list of the supported operating systems and compilers.
A short description of the DISLIN features is given in Overview while a detailed description is available in the online manual and in the alphabetical list of all DISLIN routines. The online manual can also be downloaded in HTML format as a compressed tar file. A printed book of DISLIN can be ordered from Amazon, from the publisher Shaker Media GmbH, or directly from the author. Last but not least a PowerPoint presentation of DISLIN is available in the file dislin.ppt.
The DISLIN distributions can be used freely without any restrictions. Access to the source code and a preferred support is available from this site via a contract.
News
8. April 2024
Support for Python 3.11 and Windows
28. July 2023
Bug fix for the X11 distributions
22. July 2023
Upgrade 11.5.1
25. April 2023
Support for Linux 64-bit on IBM z series
30. October 2022
Support for MingW 64-bit UCRT runtime environment
28. September 2022
Release 11.5
15. March 2022
Release 11.4
15. March 2021
Support for Free Pascal 64-bit on Windows
22. July 2020
Upgrade 11.3.3
28. June 2020
DISLIN Book Version 11 is available
8. March 2017